Consolidated Financial Highlights
(Billions of yen)
| FY2021 | FY2022 | FY2023 | FY2024 | FY2025 | |
|---|---|---|---|---|---|
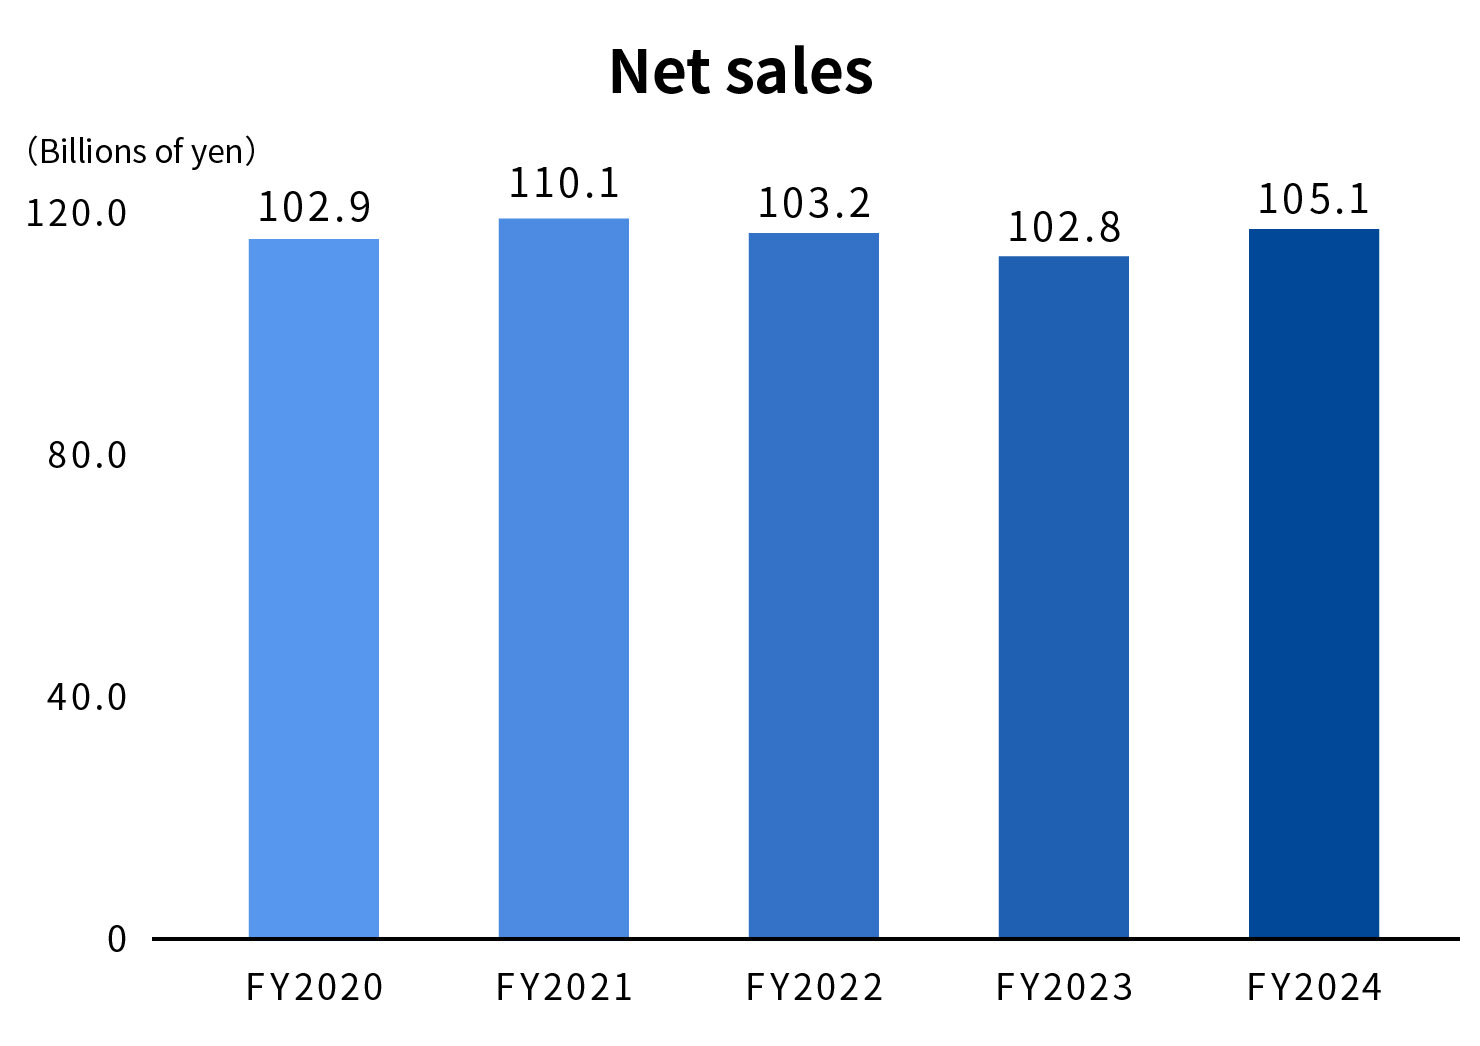
| Net sales | 110.1 | 103.2 | 102.8 | 105.1 | 116.9 |
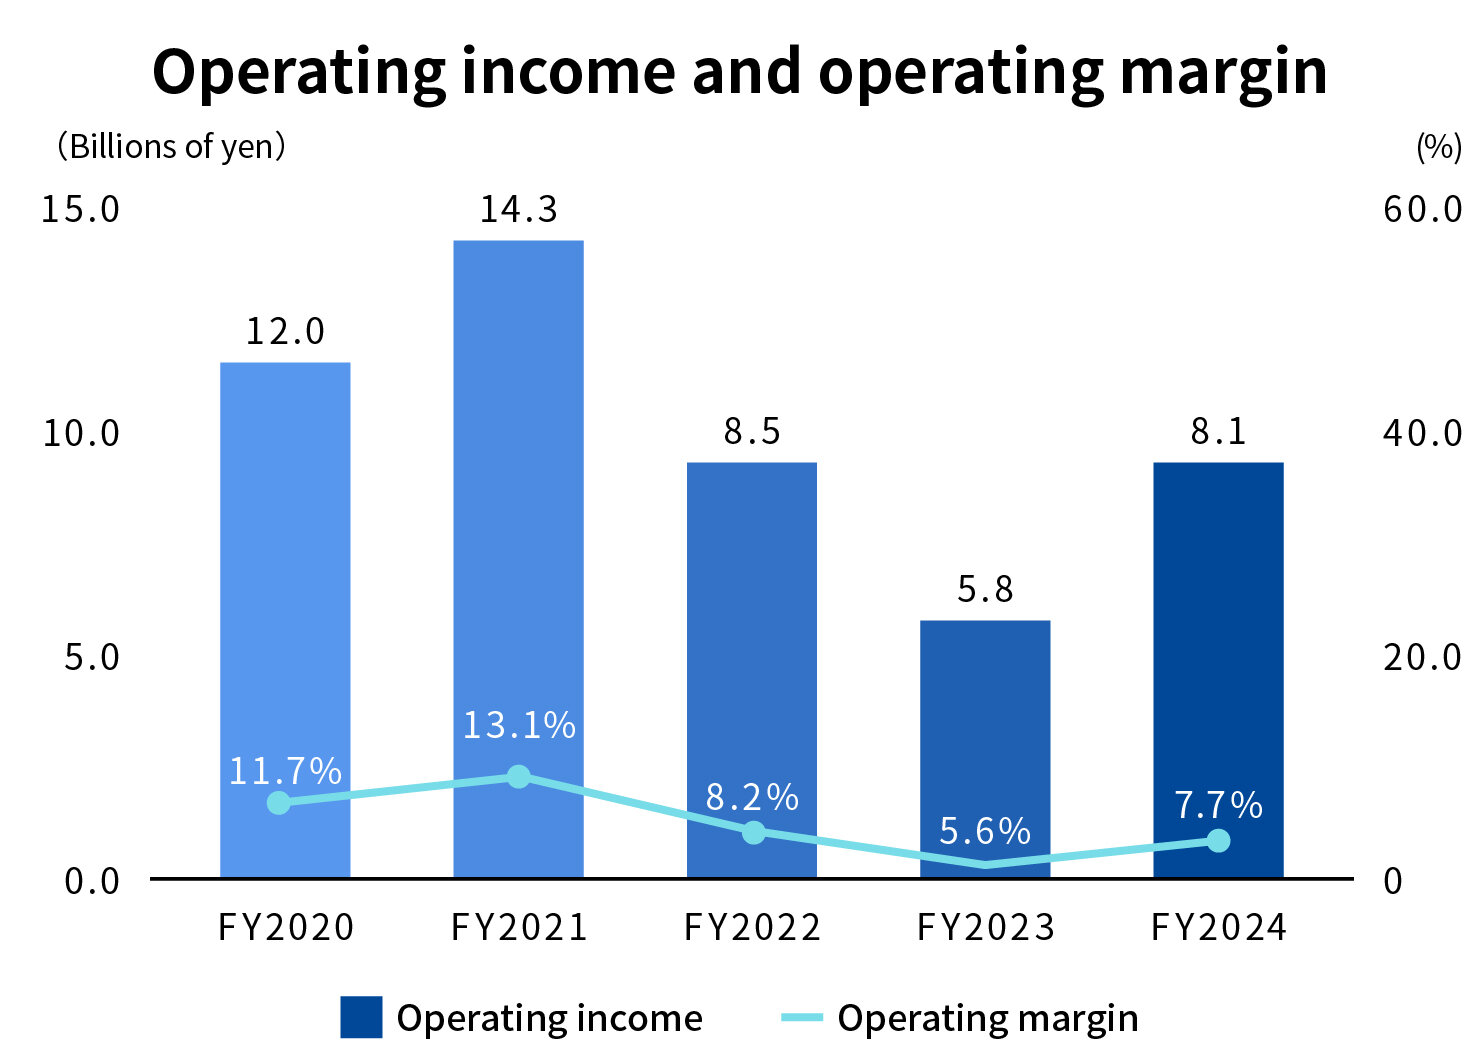
| Operating income | 14.3 | 8.5 | 5.8 | 8.1 | 10.1 |
| Recurring income | 14.7 | 9.0 | 6.0 | 8.0 | 11.1 |
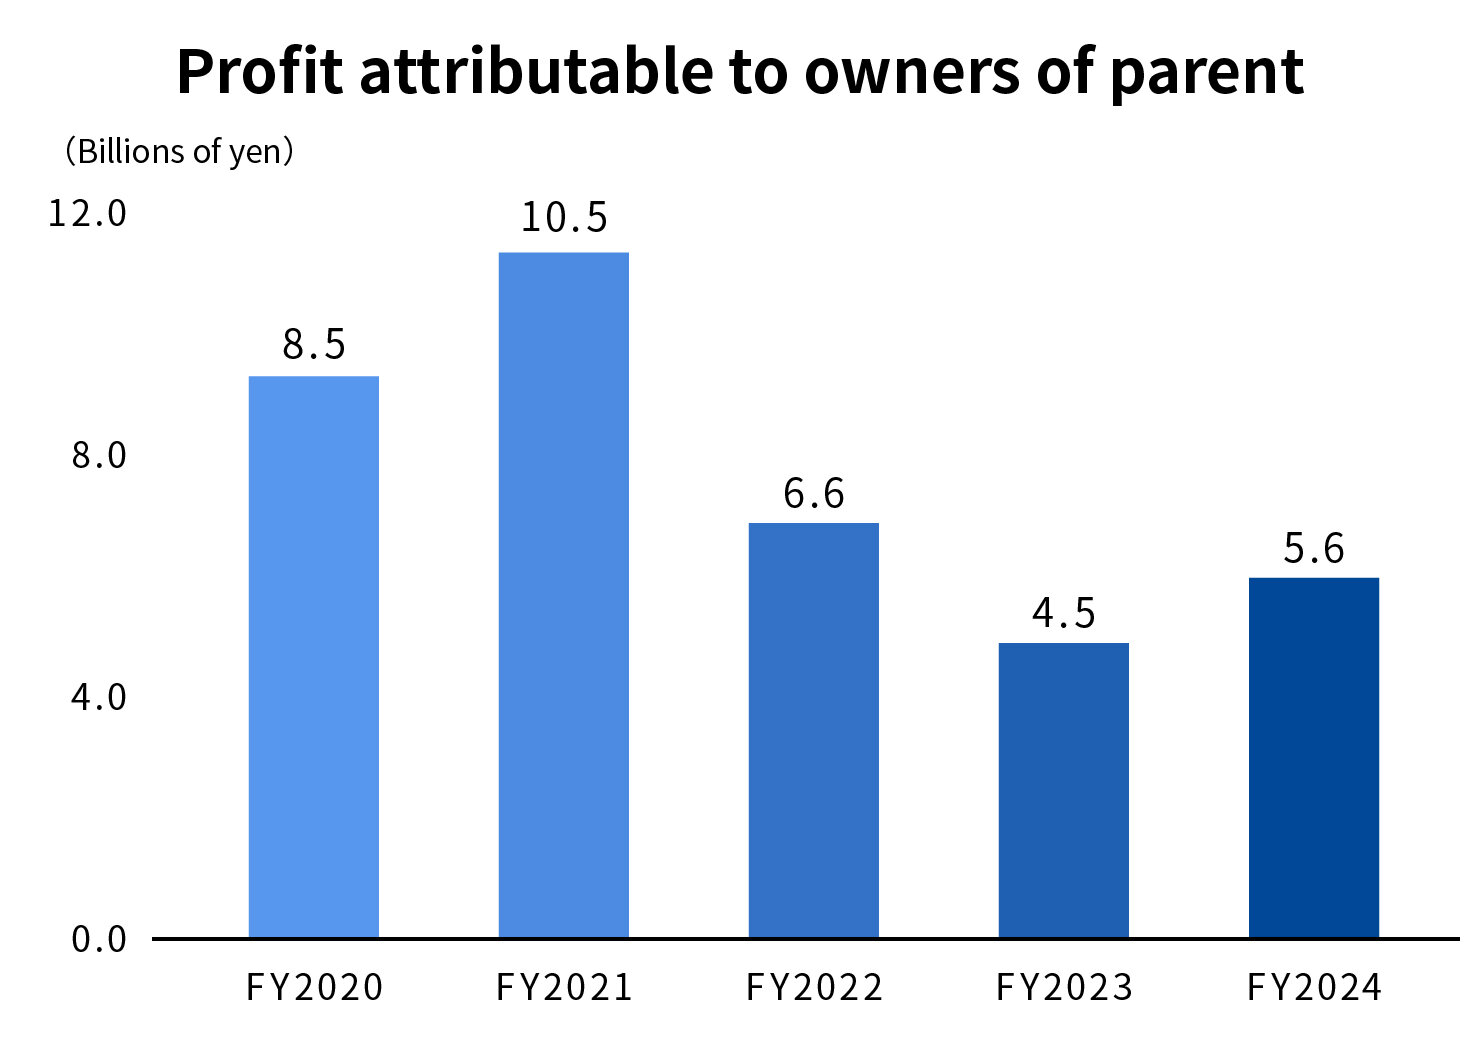
| Profit attributable to owners of parent | 10.5 | 6.6 | 4.5 | 5.6 | 7.9 |
| Capital investment | 2.8 | 2.1 | 2.3 | 1.6 | 1.8 |
| Depreciation and amortization | 2.6 | 2.6 | 2.8 | 2.9 | 2.9 |
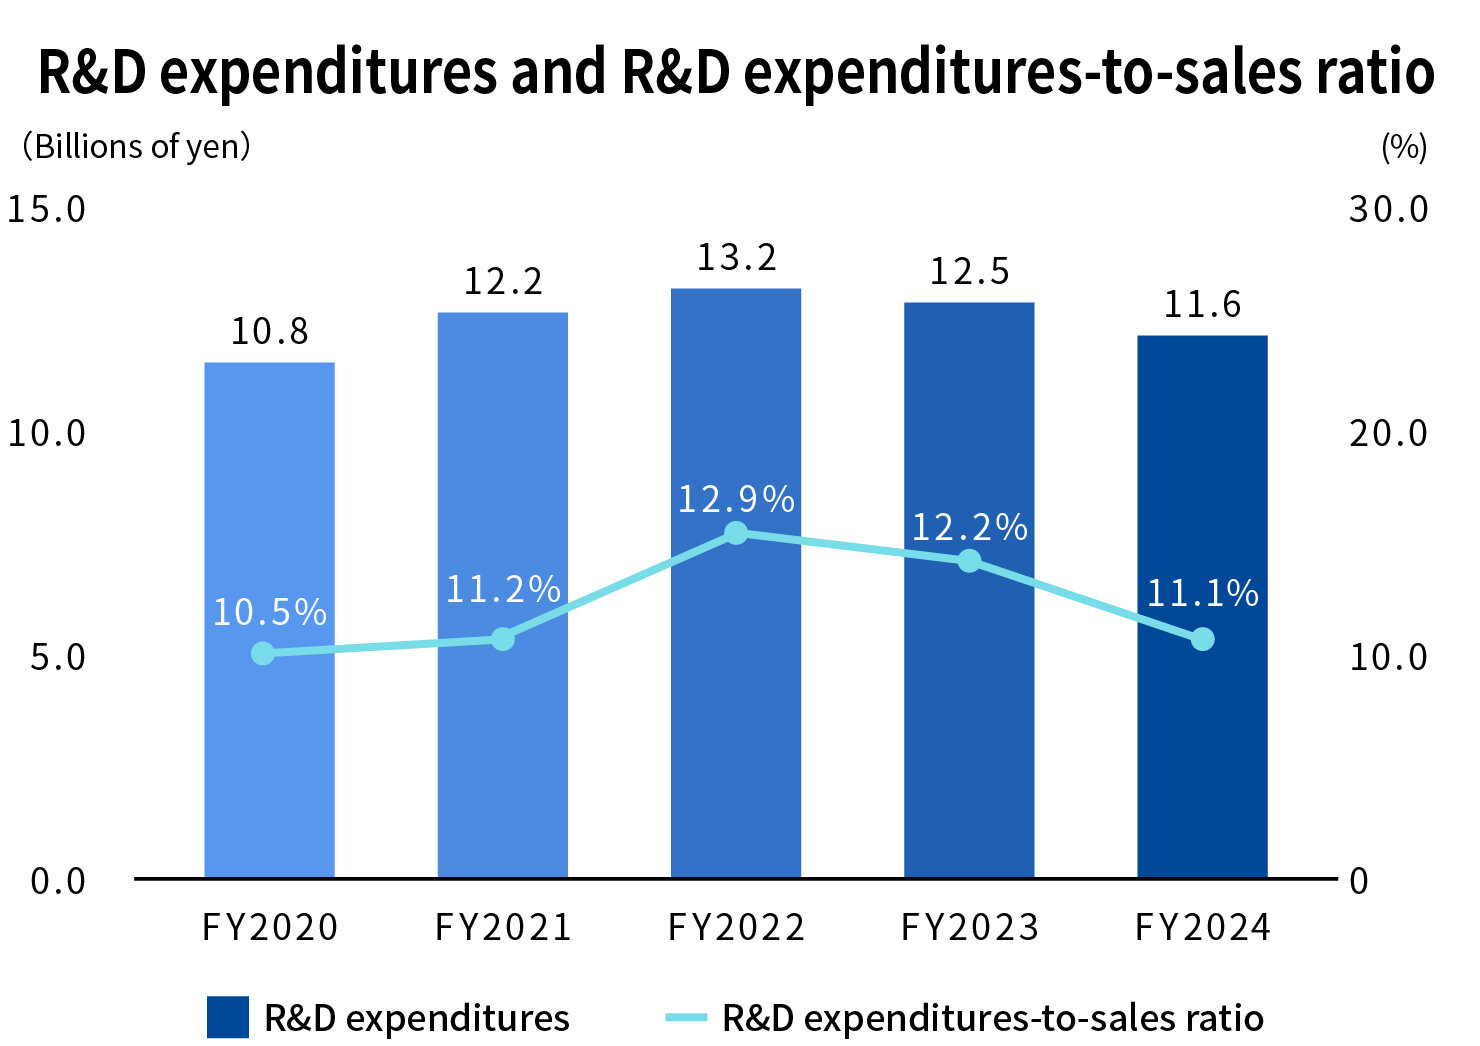
| R&D expenditures | 12.2 | 13.2 | 12.5 | 11 .6 | 12.1 |
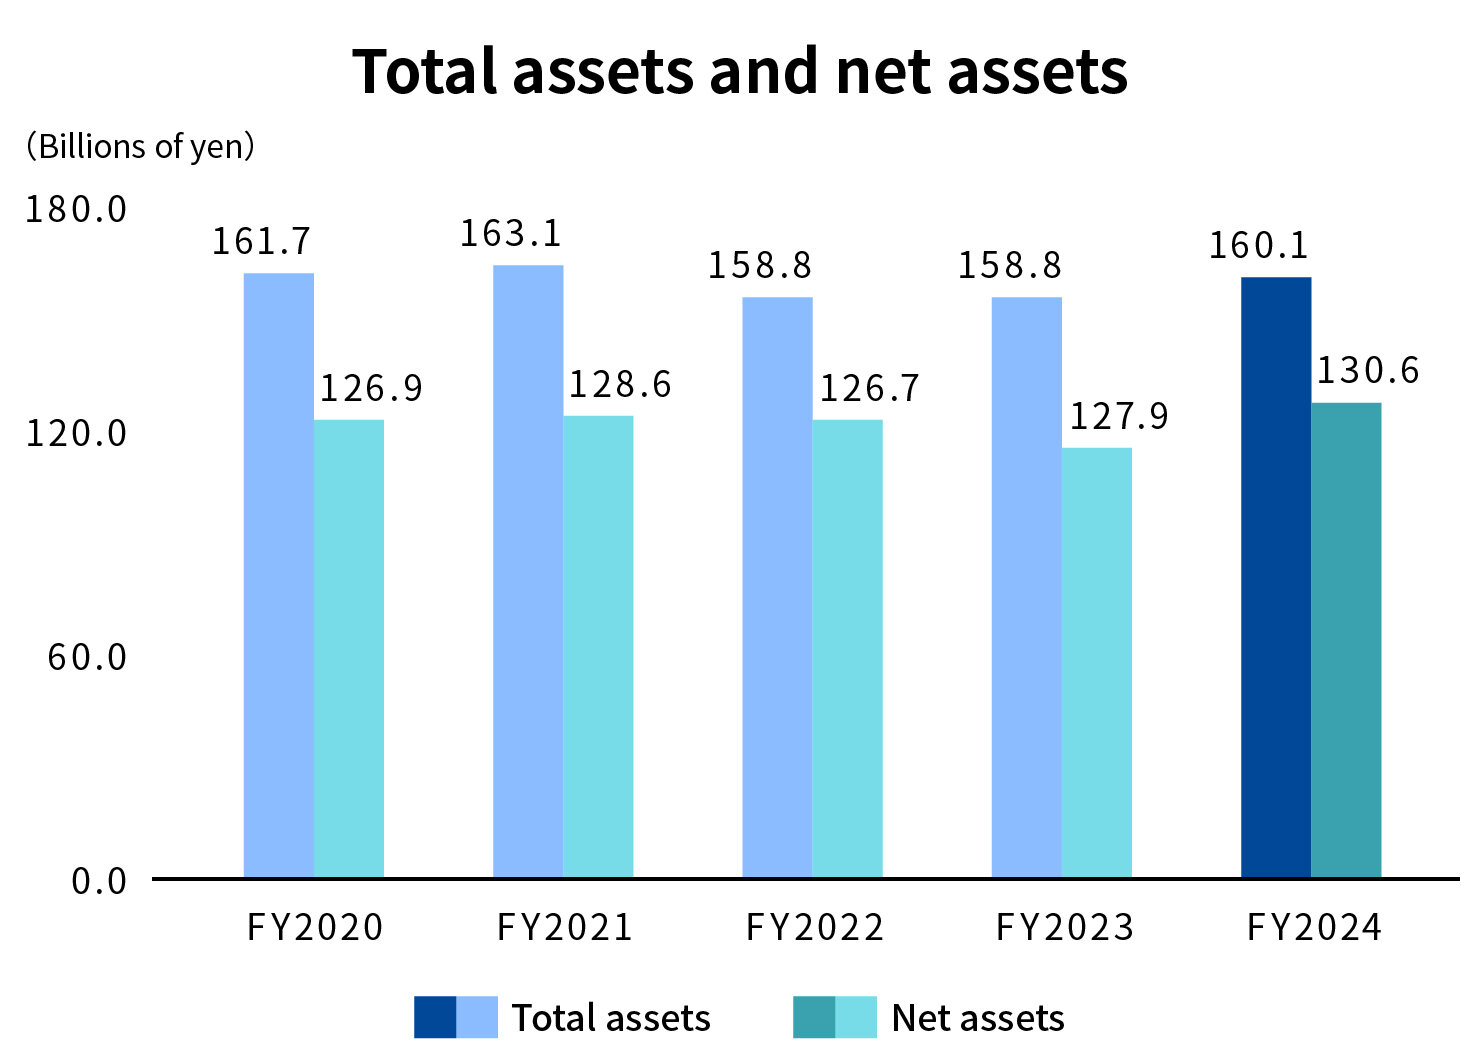
| Total assets | 163.1 | 158.8 | 158.8 | 160.1 | 182.7 |
| Net assets | 128.6 | 126.7 | 127.9 | 130.6 | 140.3 |
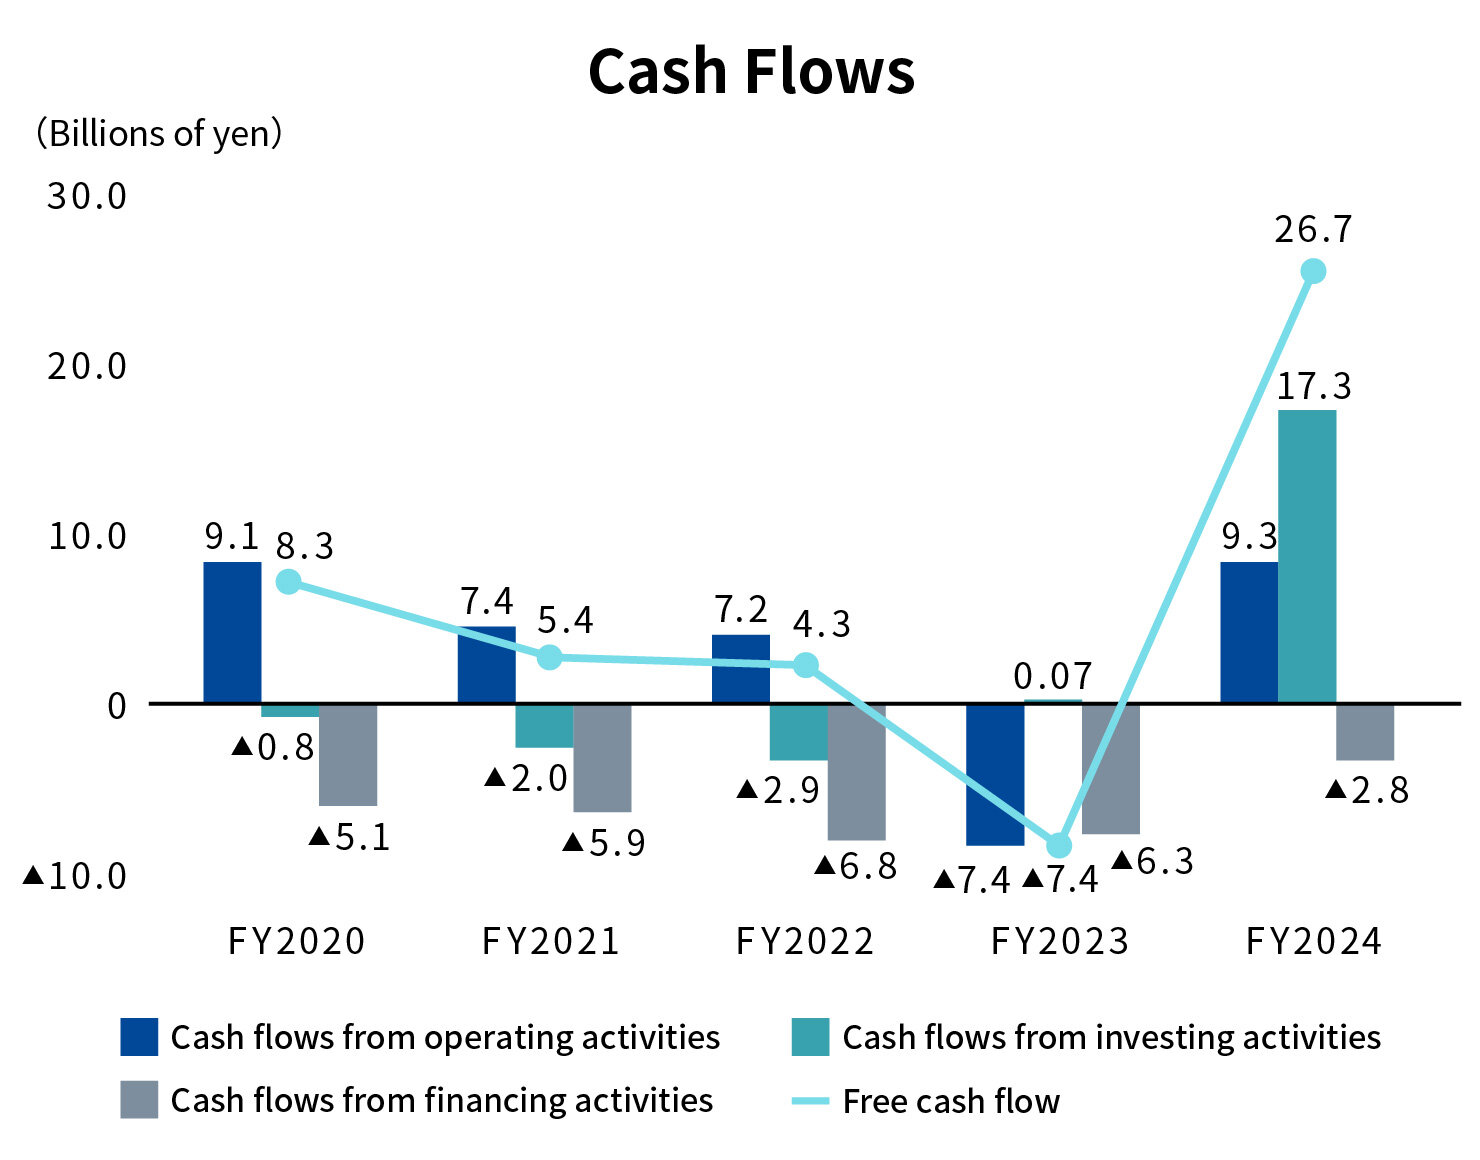
| Cash flows from operating activities | 7.4 | 7.2 | ▲ 7.4 | 9.3 | ▲ 7.3 |
| Cash flows from investing activities | ▲ 2.0 | ▲ 2.9 | 0.07 | 17.3 | ▲ 16.8 |
| Cash flows from financing activities | ▲ 5.9 | ▲ 6.8 | ▲ 6.3 | ▲ 2.8 | 7.0 |